Project Summary
This is a web map of lodgepole pine forest in transition with an overview of outbreak severity, burn severity, and forest recovery for a section of the landscape in central interior British Columbia. Forests have experienced unprecedented mortality from the recent mountain pine beetle outbreak and subsequently burned during wildfire. Land managers have been concerned about dead forest conditions and the influence dead forests may have on fire behavior and forest resiliency. This project is an overview of a large dissertation project. The composition of this site serves as a final project for class: Geovisualization provided by Oregon State University.
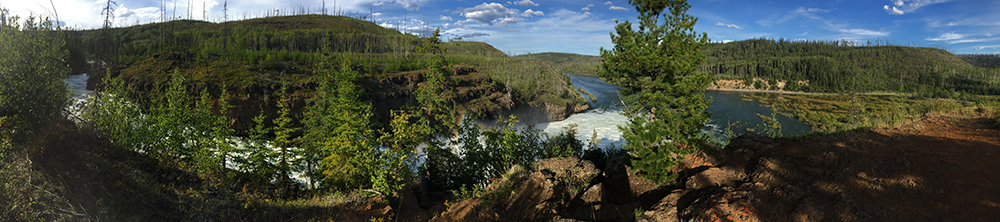
The main goals of this project were to visualize various aspects of a landscape in transition. We integrated a variety of mediums including maps, photographs, satellite imagery, graphs, and words to describe the story that is occurring across the landscapes that are transitioning through sequential disturbances of beetle outbreak and wildfire in central interior British Columbia, Canada
Background
This project is portion of a larger dissertation project that is seeking to to determine the influence of sequential disturbances of beetle outbreak and wildfire on fire severity and forest regeneration. The larger project takes a 2 pronged approach to examine these questions through empirical field based methods and through the lens of remotely sensed Landsat data analyses.
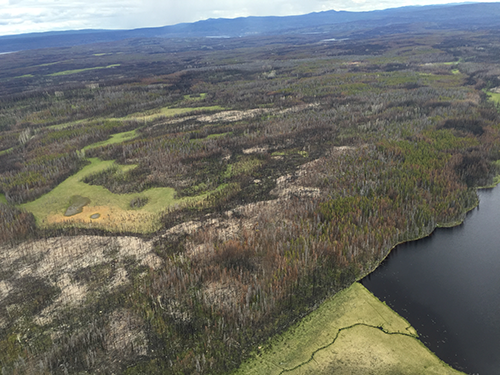
Beetle outbreaks and wildfire are broad scale disturbances that influence forest regeneration and successional processes. Understanding how these broad-scale disturbance agents operate across landscapes is enhanced using remotely sensed satellite data that allow researchers to evaluate disturbance at a broad-scale. The magnitude of the mountain pine beetle (Dendroctonus ponderosae; hereafter beetle) outbreak in central interior British Columbia, Canada has been unprecedented, affecting millions of hectares of lodgepole pine (Pinus contorta var. latifolia) forests (Wulder et al. 2006). Recent fires have burned through gray-phase outbreak conditions in 2012, 2013, and 2014 in two Provincial Parks that are managed as wilderness areas. When forest killed by the beetle outbreak subsequently burn during a wildfire, the collections of dead snags alter fire severity and seedbank availability, which in turn can influence forest recovery.
Methods
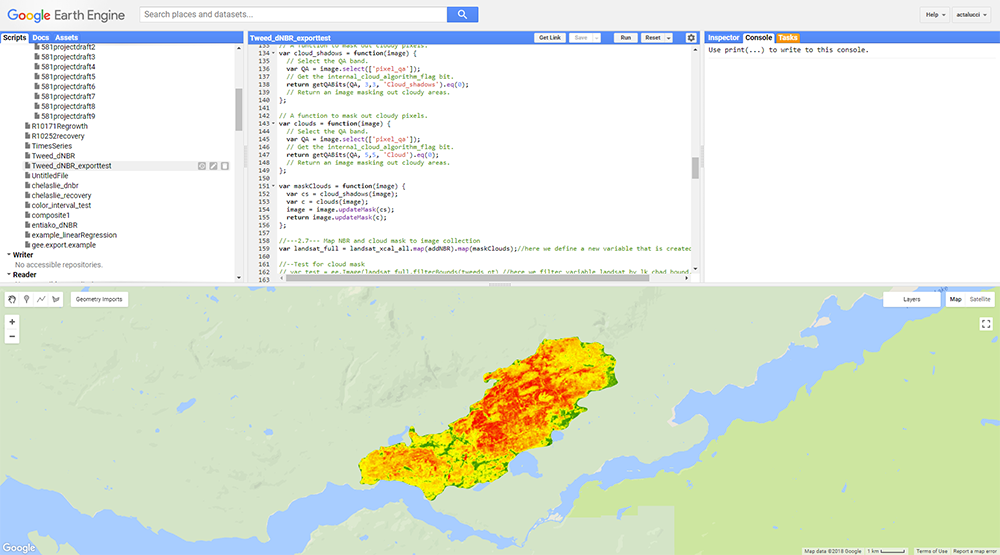
The purpose of this story map was to visualize various aspects of forest composition and structure through time as a function of beetle outbreak and wildfire for three fires that burned in Tweedsmuir and Entiako Provincial Parks. Aspects of this website are a product of remotes sensing analyses performed in Google Earth Engine. Remote sensing analyses methods are elaborated on below.
We used imagery from Landsat 5, 7, and 8, from 1997 through 2017 surface reflectance (Key and Benson 2006) and focused on growing season months, May through September. The Landsat series was harmonized following the calibration data from Roy et al (2016), which allowed us to work seamlessly across the Landsat imagery for all analyses. We generated a normalized burn ratio (NBR) band for each Landsat image in our series. We generated a cloud mask to minimize the effect of pixels covered by clouds. We performed an additional visual assessment for clouds and scan lines for imagery used outside of the time series.
Characterizing forest health and trends in disturbance are critical for both management and tracking forest recovery. Trends in forest health can be characterized well using the normalized burn ratio (NBR), which is well documented (Coops et al. 2006, Meigs et al. 2011, Kennedy et al. 2012, Pickell et al. 2016, White et al. 2017, Frazier et al. 2018). Research has primarily focused on detecting and evaluating singular broad-scale disturbance agents such as insect outbreaks, wildfires, or timber harvest (Coops et al. 2006, Kennedy et al. 2012, White et al. 2017, Frazier et al. 2018). These research approaches have been demonstrated as robust means of evaluating broad-scale disturbances such as insect outbreaks and wildfire. Effects of sequential disturbances of beetle outbreak and wildfire have yet to be evaluated in the central interior. Our broad overarching question is, what effect do beetle outbreak conditions have on fire severity and regeneration at landscape scales? The goal of this project is to conduct exploratory research on three fire event that burned through beetle outbreak affected forests in wilderness areas. Our objectives are twofold: first to generate a time series for the region showing the decline in forest health from the outbreak followed by subsequent fire and a brief snapshot of recovery (Meigs et al. 2011, Kennedy et al. 2012). Second, to develop a series of disturbance and regrowth maps to characterize the amount of change (Kennedy et al. 2012, White et al. 2017, Frazier et al. 2018).
We calculated the differenced normalized burn ratio (dNBR) to characterize various snapshots in time during sequential disturbances (Key and Benson 2006, Kennedy et al. 2012). We calculated burn severity and regrowth. Regrowth quantified the change in condition between one-year postfire and the most recent growing season (Kennedy et al. 2012, White et al. 2017).
Design and Program
• Storymap: Storymap is the core design piece of this website and is made up by several scenes:
• Launch Page, Overview, Lodgepole Pine Forests, Beetle Outbreak Severity, Wildfire, Forest Recovery.
• For each scene, there is a panel with a description and a map with basemap, thematic layers, and interactive features to illustrate the setting.
• Leaflet: Leaflet is the leading open-source JavaScript library for mobile-friendly interactive maps and was used to support the map portion of the storymap.
• Bootstrap: Offers a framework to line up icons and text that were displayed in the Info scene.
• Markercluster Photo: This was used to integrate photographs for various aspects of the landscape.
• Photos are used in the scenes for Outbreak, Wildfire and Recovery.
• Photos have geo-tags that associates them with specific areas that may exhibit the feature captured in the photo.
• The photos are shown on the map as clusters of thumbnails, and hovering on each thumbnail opens the image in the left panel.
• d3 bar-graph: This was used in the Overview scene to display accumulated outbreak mortality from a csv file.
• Color design: Aspects of our color design palette were used in the progress bar.
• QGIS: Raster to tile conversion.
• Illustrator: Adobe software was used to design the favicon and resize photos for the website.
• Font Awesome icons: We used font awesome icons for the Overview scene and the nav bar: location, bug, fire, and github.
• Google Fonts: Use Google Fonts to define the text fonts(both paragraph and map label).
Reflection on this project
The project provided an excellent opportunity to apply concepts learn throughout the term in Geovisual Analytics
at Oregon State University. This project was a group effort with everything from brainstorming to production of
the site. We both had limited experience with web coding, but learned to utilize GitHub and online resources to work together to
produce this project. The largest hurdle for this project was integrating remote sensing analyses from Google Earth Engine.
We consulted with the faculty advisor for the course and utilized other peoples expertise
in the class.
Our Team

Michael Cook
B.S. | Natural Resources

Anna Talucci
PhD | Forest Ecosystems and Society
